Four surgical payment integrity trends to watch in 2024
Guynelle Brown, M.D. and Jonathan Edwards

Surgeries and other invasive procedures are important components of the healthcare system and account for up to 20% of ambulatory medical spend in the U.S. During the onset of the COVID-19 pandemic, many adults opted to postpone or cancel elective surgeries, resulting in an increase in healthcare utilization from delayed procedures in the years since. The subsequent rebound in healthcare utilization puts payers in the challenging situation of managing the care of their members while maintaining high standards of payment integrity and reducing costs amidst the influx of surgical procedures.
In this edition of Payment Policy Insights, we delve into four key trends surrounding surgical spend and utilization, highlighting the implications for payers and payment integrity programs.
Surgical utilization is on the rise
Surgical utilization has increased as deferred care continues to rebound from the pandemic. Between 2021 and 2023, the compound annual growth rate (CAGR) of surgical procedure utilization increased up to 4%, with the highest increase observed in Medicare, as seen in Figure 1.
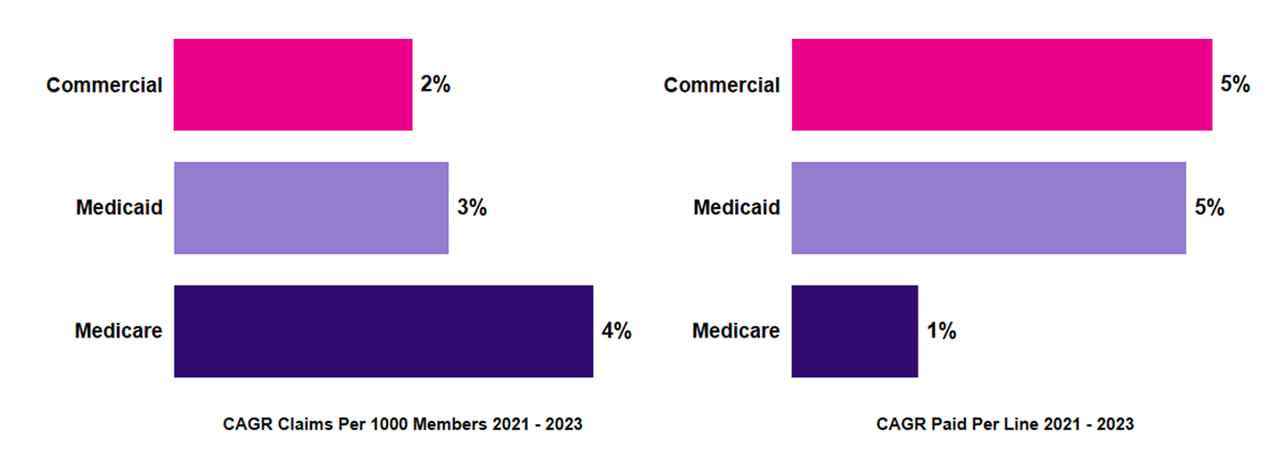
Figure 1. Growth in utilization and unit cost by line of business (2021–2023).
The increase in utilization reflects the unique demographic profiles in each line of business (LOB). The most common surgical procedures in the commercial sphere were hysterectomies and joint replacements; in Medicaid, pediatric ear, nose, and throat (ENT) procedures; and in Medicare, cardiac studies and orthopedic surgeries. Colonoscopies emerged as a prevalent procedure among all three LOBs.
Shift in care to outpatient facilities has increased surgical costs
Figure 1 also shows that surgical unit costs, as measured by the Paid per Line metric, increased up to 5% on an annual basis, with the highest increases across commercial and Medicaid plans. This increase reflects a shift in medical expenditure towards outpatient hospitals, which accounted for up to 73% of surgical spend in 2023 (Figure 2).
Clinically, the rising trend is driven largely by joint replacements and colonoscopies. This pattern may be influenced by changes to Medicare’s inpatient-only policy, which allowed more orthopedic surgeries outside of inpatient hospital settings beginning in 2020.
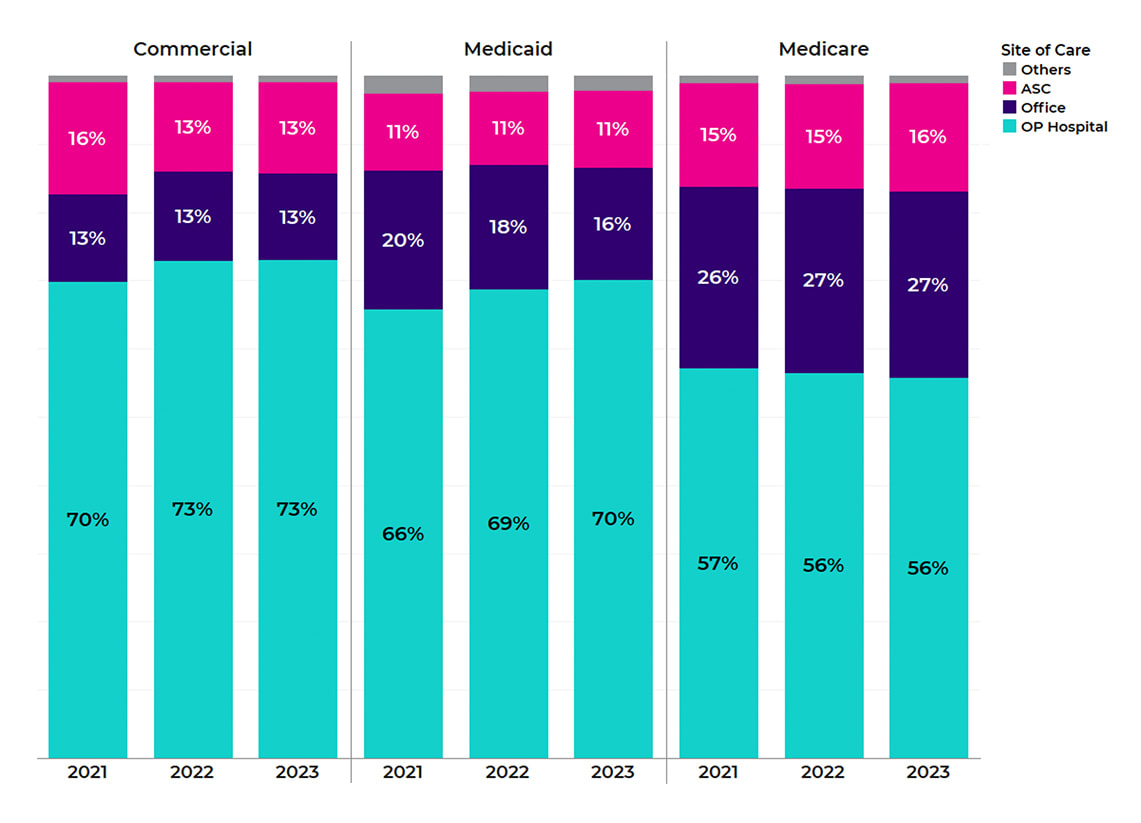 Figure 2. Shift in share of spend, by site of care (2021–2023).
The shift in surgical spend towards outpatient hospitals is a key cost driver, as outpatient hospital procedures typically cost more than other places of service such as ambulatory surgical centers (ASCs). Seven of the top 10 surgical procedures have higher costs when performed in outpatient hospitals, reflected by the additional expenses of facilities, equipment, and supplies. Opportunity exists to perform some of these procedures in lower-cost ASCs, where unit costs decreased 1% on an annualized basis (Figure 3). These trends demonstrate the importance of a comprehensive payment integrity program that addresses outpatient facility claims.
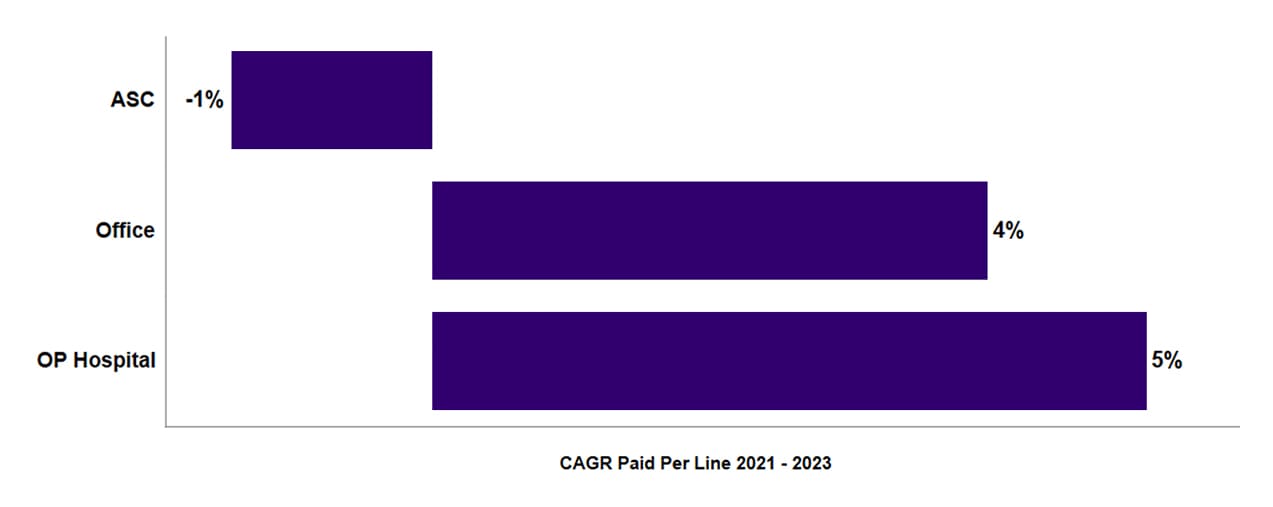
Figure 3. Growth in Paid per Line by site of care.
Five payment policy areas capture nearly two-thirds of surgical claim savings
About half of health plans capture billing and coding errors on 3–7% of surgical claims, with the highest error rates on Medicaid claims. Five medical policy categories in Cotiviti’s Payment Policy Management library account for 64% of prospective payment integrity savings on surgical claims, including the Modifier Policy, National Correct Coding Initiative Policy, Diagnosis Code Guideline Policy, Global Surgery Policy, and Duplicate Services Policy (Figure 4).
Among the top 10 surgical procedures by spend, colonoscopies have notably higher billing error rates (Figure 5), largely reflecting the improper use of modifiers by providers. These errors emphasize the importance of implementing pre-payment modifier review within payment integrity programs.
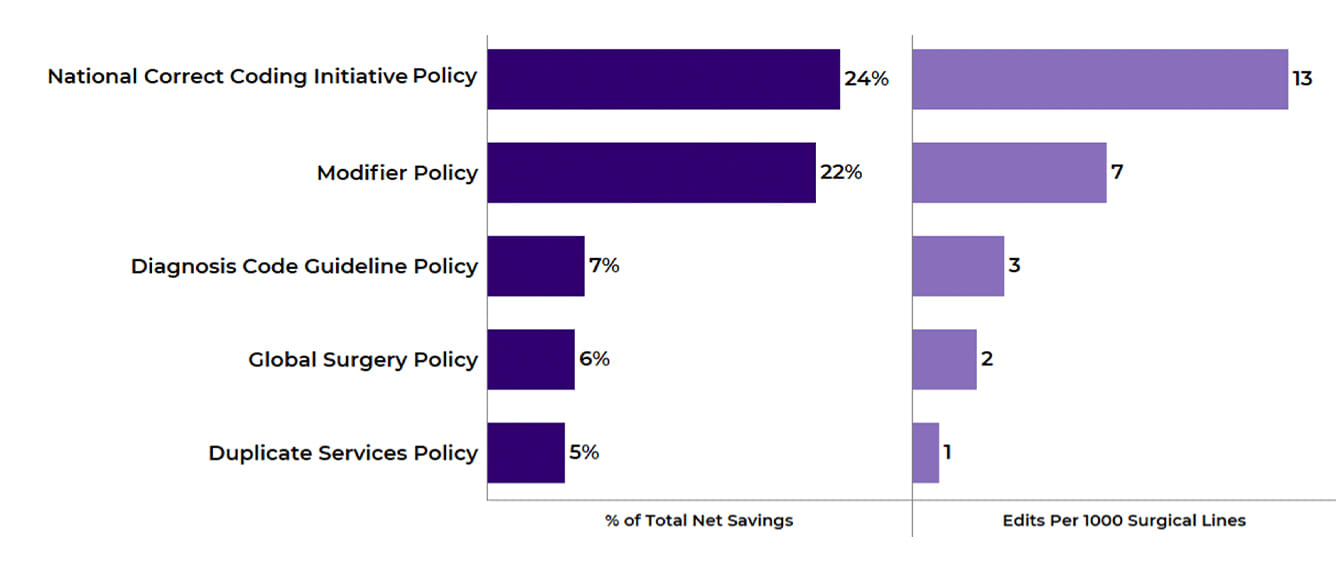
Figure 4. Percentage of Total Net Savings and Edits Per 1000 Surgical Lines in 2023 for top policy areas.
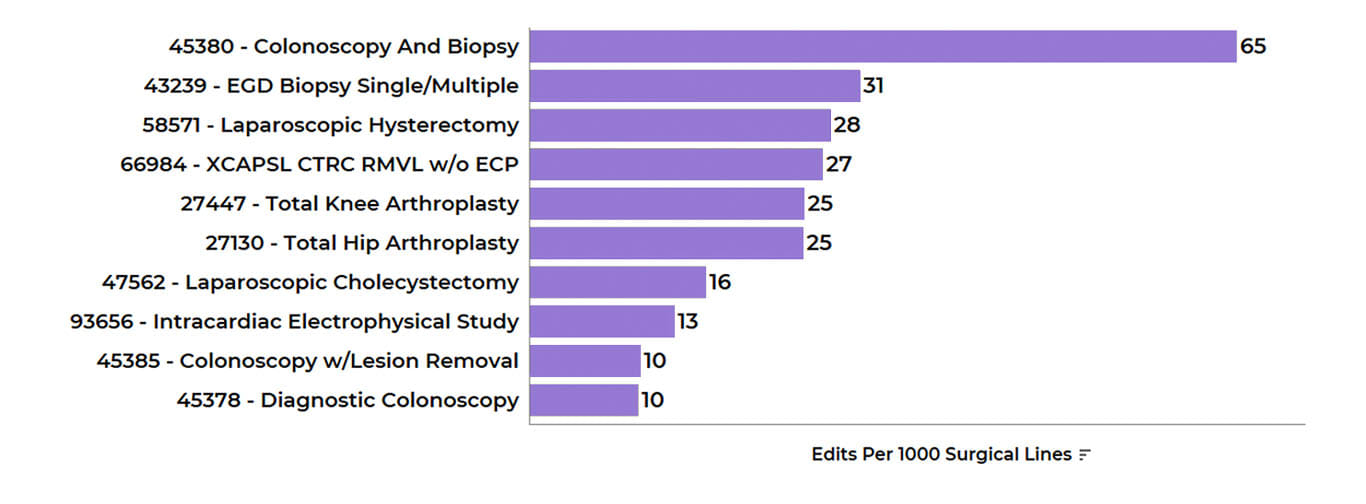
Figure 5. Edits per 1000 Surgical Lines in 2023 for top surgical procedures (by spend).
Plans with comprehensive policy sets capture 6x more savings
While approximately half of health plans capture billing and coding errors on 3–7% of surgical claims as noted, plans in the top performance quartile correct errors on up to 20% of claims. These plans deploy more comprehensive payment policy sets, capturing up to six times more savings on surgical claims (Figure 6) and experiencing lower adjustment rates. Specifically, payers in the top quartile of editing performance capture 4.3% net savings with a 21% adjustment rate, while payers in the bottom quartile capture only 0.7% net savings with a 39% adjustment rate.
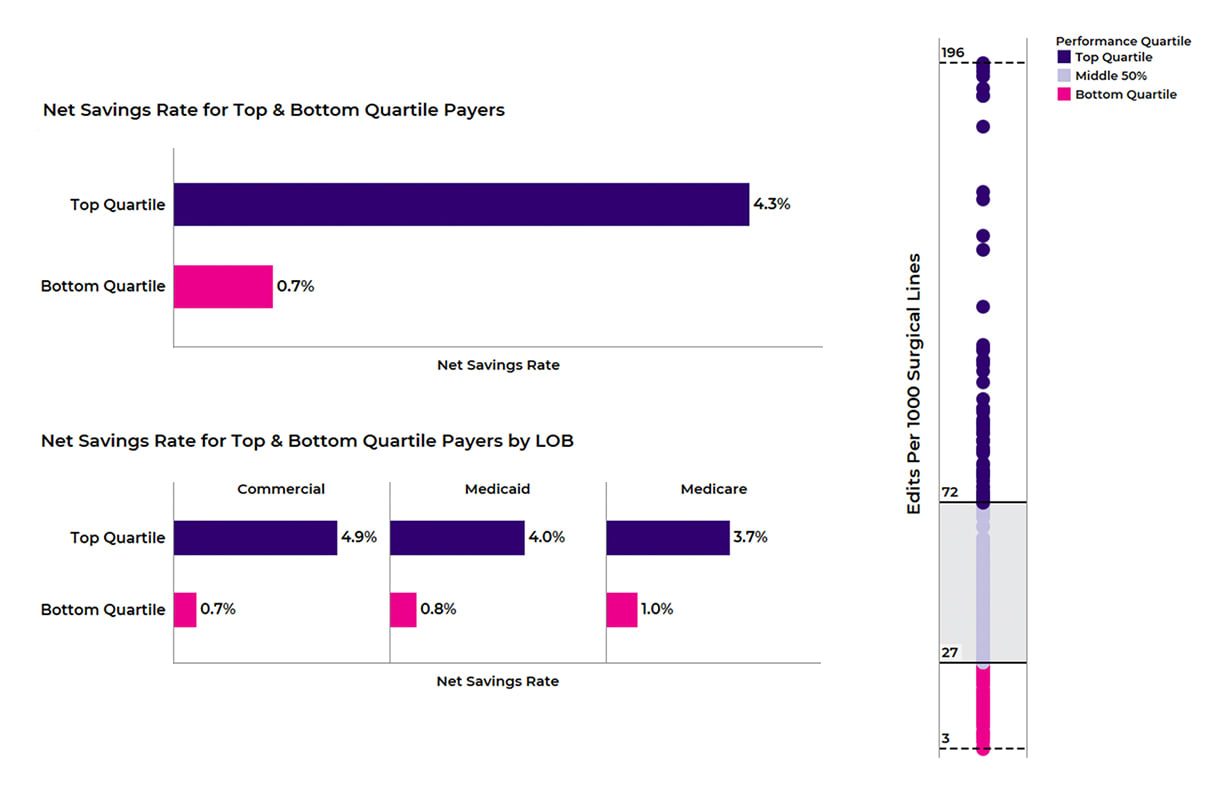
Figure 6: Net Savings Rate (L) and Edits per 1000 Surgical Lines (R) for top quartile vs. bottom quartile payers.
Cotiviti’s data shows that payers in the top quartile deploy more claim editing rules across the top five medical policy areas and have editing rates more than five times higher within the Modifier Policy and NCCI policy areas (Figure 7). Importantly, high-performing payers have implemented modifier review edits that identify inappropriate modifier usage on procedures such as colonoscopies.
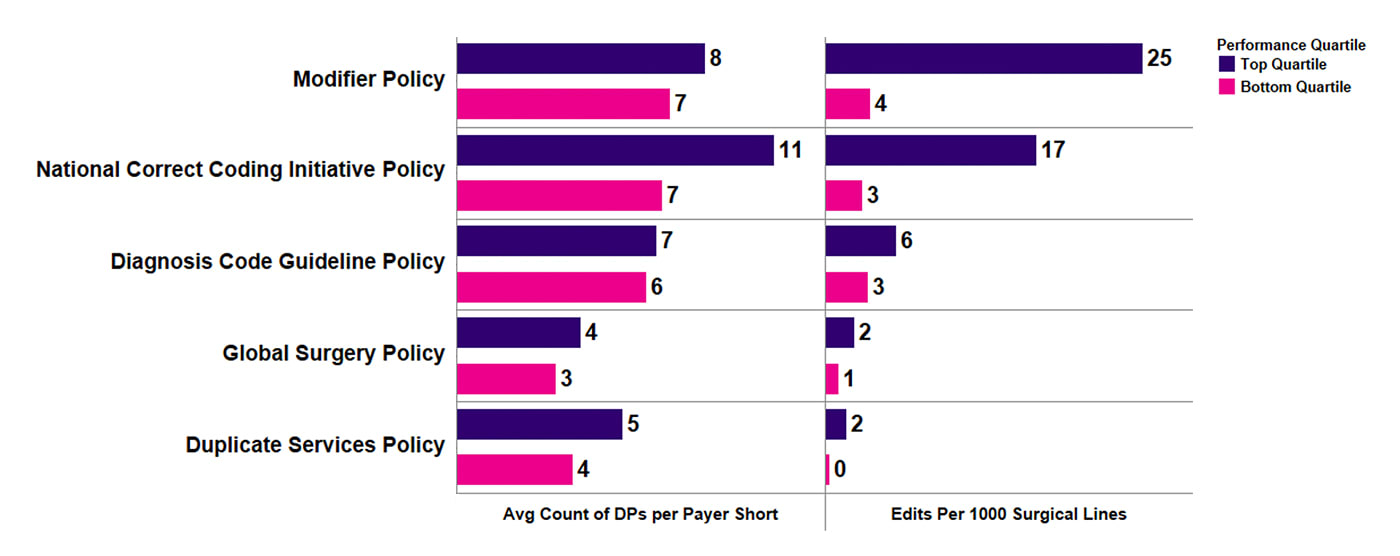
Figure 7. Average count of Decision Points (DPs) Adopted per Payer Short and Edits per 1000 Surgical Lines for top policies (by performance quartiles).
As deferred care continues to rebound post-pandemic, plans should prepare for the continued influx of surgical utilization. To control rising surgical costs, payers should deploy payment policies that address all sites of care (including outpatient facility), inappropriate modifier use, unbundling, and other impactful billing/coding errors. Cotiviti enables payers to tackle this challenge with a comprehensive payment policy library and prepayment review that addresses a wide range of claim types.
Learn more about the policies related to surgical claims to help you build a more comprehensive policy set, increase savings, and set up your plan for success. Please reach out to your Cotiviti Client Engagement representative to get started on the path to achieving more accurate payments and better results.
|
|
Guynelle Brown, M.D. Dr. Brown is an expert in clinical coding and has rich experience in direct patient care, coding research and training, policy development, data analytics, and client management. She joined Cotiviti nearly 20 years ago as a research medical director and has served as a senior medical director working extensively with Cotiviti's new customers and existing clients for several years. She attended medical school and completed her general surgery residency at the Medical College of Georgia and practiced general surgery before becoming a medical director for a large health plan. |
|
Jonathan Edwards Jon leads a talented team of analytic professionals that deliver actionable insights powering Cotiviti’s most important growth opportunities. With more than 15 years of healthcare analytics and consulting experience, Jon harnesses the power of data to develop leading-class analytic products and services that inform decision-making, accelerate growth, and differentiate Cotiviti’s value proposition. |