E/M utilization and medical drug spend
Jonathan Edwards | Roland Self

Evaluation and management (E/M) services and medical drugs represent a significant portion of healthcare spending, accounting for nearly 42% of total medical costs in ambulatory care according to data from the Centers for Medicare & Medicaid Services (CMS). Both categories have seen consistent annual growth in claims utilization at roughly 3-4% per year.
In recent years, shifts in care delivery, increased patient complexity, and the growing use of high-cost therapies have introduced new challenges for health plans to ensure payment accuracy. This growth, coupled with increasingly complex billing practices, highlights the importance of robust payment integrity programs.
In this Payment Policy Insights investigation, we examine key trends in E/M utilization and medical drug spend and address how payment integrity policies can play a proactive role in identifying billing errors, helping payers to contain costs and ensure appropriate reimbursement.
E/M utilization faces a sharp increase in demand and over-coding errors
According to Cotiviti data, utilization of E/M services has risen by 3% annually over the last three years, with professional E/M services increasing by 2% per year—driven largely by office visits and behavioral health—and emergency department (ED) facility E/M services growing by 8% per year. Simultaneously, unit costs for facility E/M services have climbed 3% annually, compared to 1% for professional E/M.
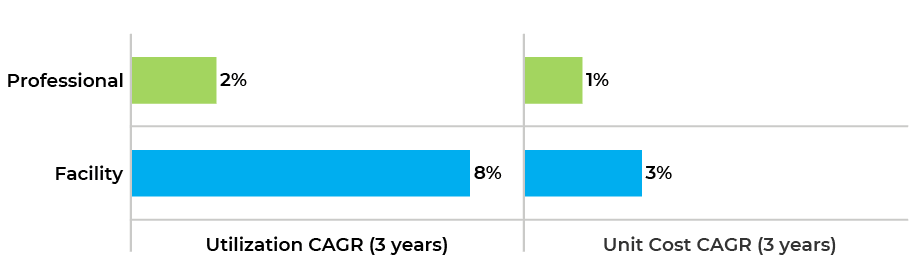
Figure 1. Change in utilization (claims per 1,000 members) and unit cost (paid per line) by claim type for E/M claims.
E/M claims represent a significant payment integrity challenge for payers due to the volume of services and criteria used to determine the complexity of certain visits. Over-coding, or submitting claims for a higher level of service than provided, now contributes to almost a quarter of all E/M billing errors. This shift toward higher service levels may be influenced by recent coding changes, reimbursement pressures, or provider practices. But diagnosis profiles remain largely unchanged, suggesting over-coding rather than increased patient acuity.
Cotiviti’s E&M over-coding program is designed with an outlier approach, focusing on providers with high volumes and rates of over-coding, thus minimizing broad abrasion and unnecessary amendments. Cotiviti’s analysis shows that close to 40% of professional providers over-code at least half of their E/M services.
Analysis reveals that level 4 and 5 E/M services account for nearly half of all E/M claims, with utilization up 4% annually. Behavioral health codes like psychotherapy procedure code 90837 continue to rise by 11% each year.
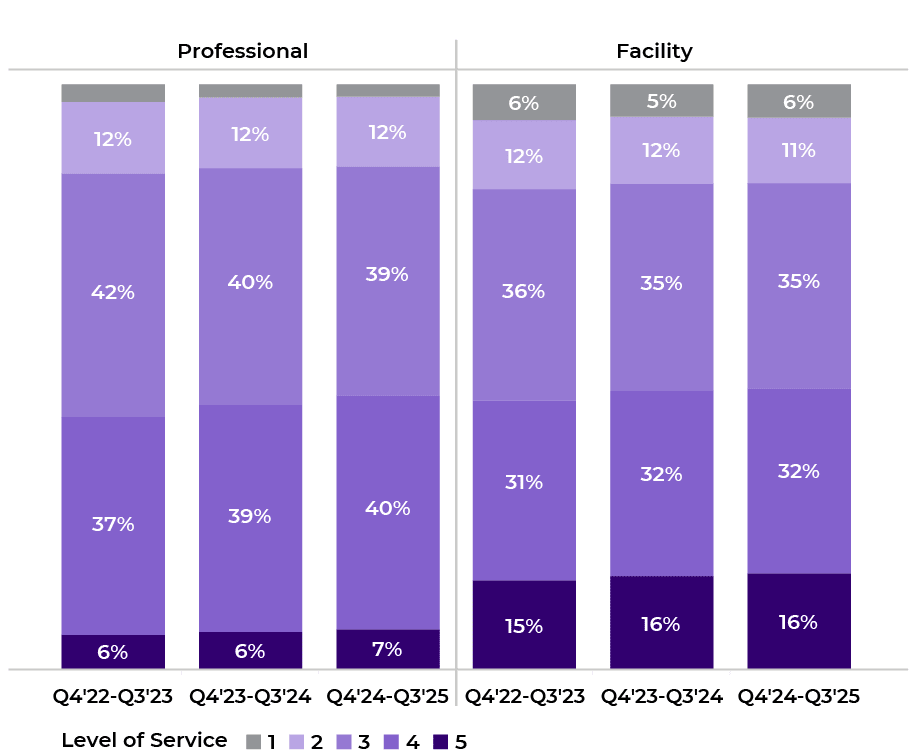
Figure 2. Distribution of E/M claim lines by level of service.
Cotiviti’s top policies that facilitate correct coding on E/M Services play a critical role in curbing excessive billing and ensuring accurate payment, with the top five medical policies accounting for more than 77% of all edits and savings.
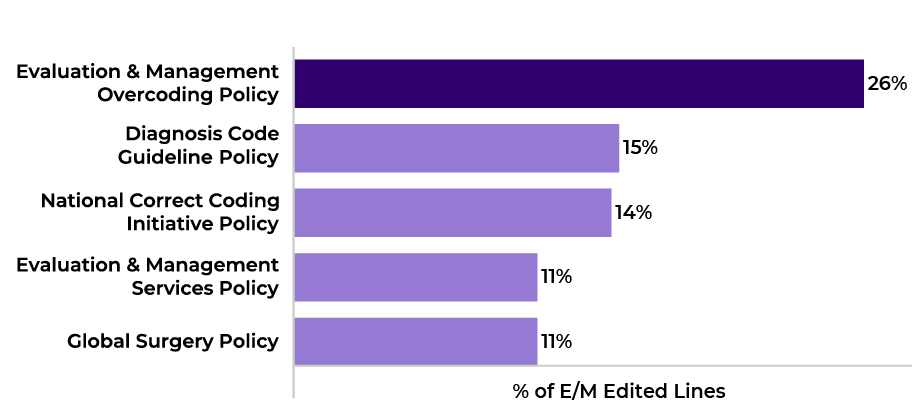
Figure 3. Distribution of E/M edited lines by medical policy (Q4 2024–Q3 2025).
Adoption of Cotiviti’s E/M over-coding program varies significantly between national and regional health plans. In the latest quarter, 100% of Cotiviti’s national clients were active on the program compared to just 17% of regional clients. Both segments show low adjustment rates (7% for national, 3% for regional), reflecting the program’s precision. National clients have also expanded their scope to include ED E/M claims, with 71% of national clients active in this area versus only 10% of regional clients. Over 65% of ED E/M savings have been generated via over-coding edits.
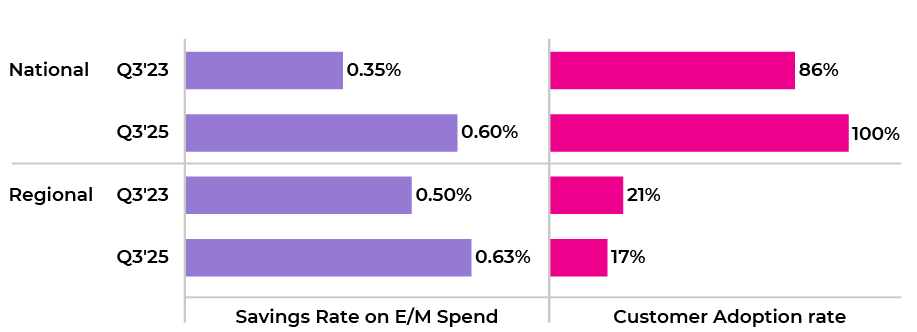
Figure 4. Savings rate and customer adoption rate (% of active customers) on E/M overcoding policy for national vs. regional clients.
Medical drug spend and wastage
Cotiviti data reveals that medical drugs contribute 13% of total ambulatory spend, with utilization growing 4% annually and unit costs rising by 7% per year. Outpatient claims for medical drug utilization have increased by 6% year-over-year, while professional claims rose by only 1%. Medicare drug spend has experienced the fastest growth in both utilization and unit cost, largely due to high-cost chemotherapy drugs such as Keytruda.
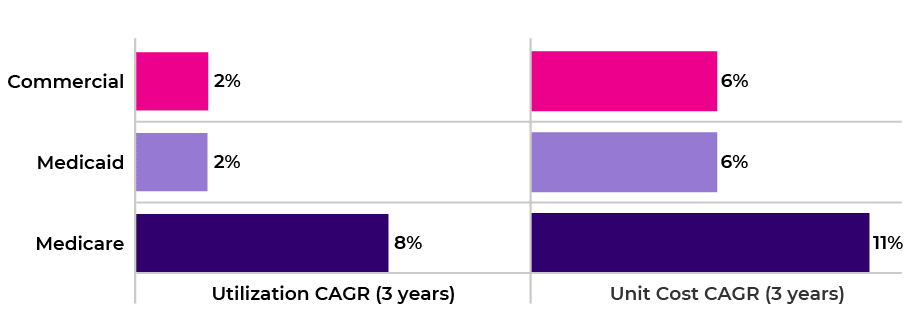
Figure 5. Change in utilization (claims per 1,000 members) and unit cost (paid per line) by line of business for medical drug claims.
A growing segment of medical drugs is subject to drug wastage reporting using the JW and JZ modifiers. The JW modifier allows providers to bill for wasted drugs, while the JZ modifier, introduced in 2023, indicates when a full vial was administered. Utilization of drugs requiring these modifiers are growing at twice the rate of other medical drugs, with chemotherapy drugs making up more than 51%. This trend underscores the importance of payment integrity policies that address correct modifier usage to minimize waste and ensure accurate reporting.
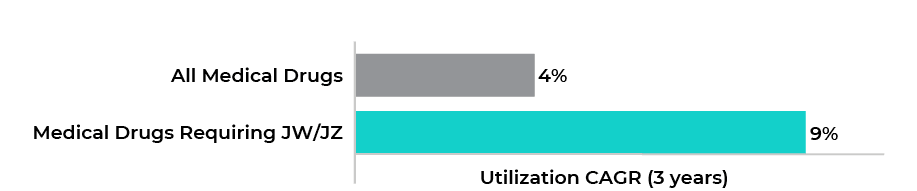
Figure 6. Change in utilization (claims per 1,000 members) for all medical drugs vs drugs that are required to be billed with JW/JZ.
Among Cotiviti’s clients, Medicare Advantage plans lead in modifier adoption, with 77% of spend billed using JW/JZ, compared to 48% for commercial and 40% for Medicaid. Cotiviti’s drug wastage policy targets three main errors: missing or inappropriate use of modifiers, incorrect code application, and excessive wastage units. In the latest quarter, Cotiviti data revealed 81% of savings on drug wastage policies resulted from addressing inappropriate or missing modifiers. More Cotiviti clients continue to implement these policies, with payer adoption rates rising from 37% to 60% in less than three years following the JZ modifier mandate in July 2023.
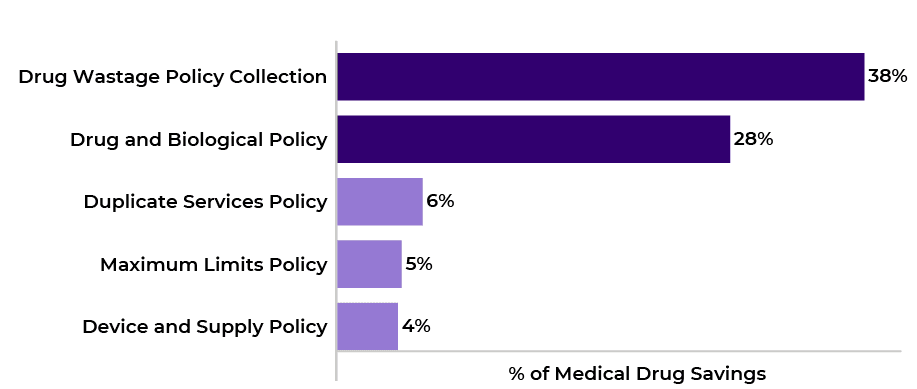
Figure 7. Top 5 medical policies for medical drugs (Q4 2024–Q3 2025).
Adoption of the drug wastage policy collection is stronger among national clients, with 100% active participation in the latest year versus 60% for regional clients. Over time, the implementation of these edits has resulted in fewer claim adjustments, indicating improved provider compliance and more accurate reporting. Some large payers now generate as much as 3% of medical drug savings from wastage policies alone, according to Cotiviti data.
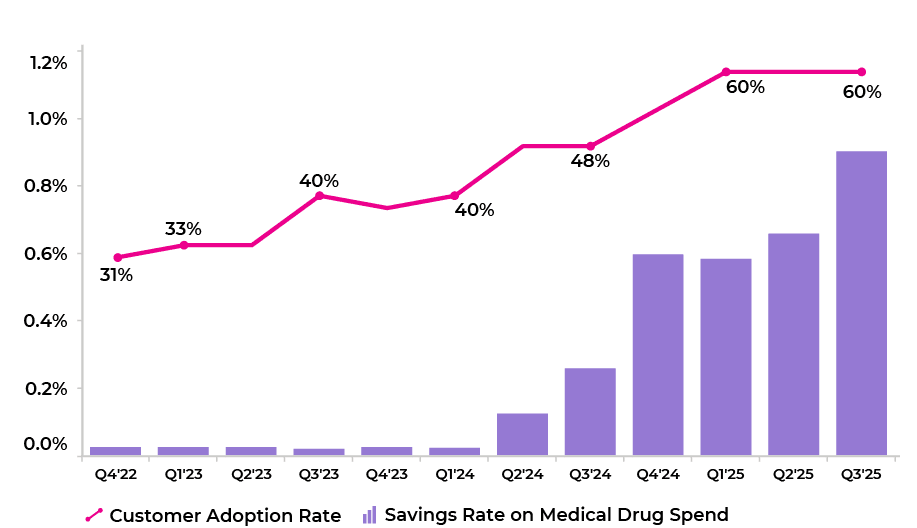
Figure 8. Trend in customer adoption rate (% of active customers) and savings rate for drug wastage policy collection.
Key takeaways
Over-coding in E/M services and inadequate reporting of drug wastage can lead to substantial financial losses if not addressed proactively. Cotiviti’s targeted policies have demonstrated a measurable impact in capturing billing errors, generating savings, and improving provider compliance, especially among national health plans.
For payer and payment integrity leaders, these trends underscore the value of effective claims management strategies that leverage policy-driven solutions. Adopting and optimizing these policies remains critical for cost containment, regulatory compliance, and maximizing value for members.
If you would like to discuss your current E/M policy set within Payment Policy Management or want to learn more about modifier reviews through our Drug Wastage policy collection, reach out to your Cotiviti representative or email us at answers@cotiviti.com.
About the authors
|
|
Jonathan Edwards Jon leads a talented team of analytic professionals that deliver actionable insights powering Cotiviti’s most important growth opportunities. With more than 15 years of healthcare analytics and consulting experience, Jon harnesses the power of data to develop leading-class analytic products and services that inform decision-making, accelerate growth, and differentiate Cotiviti’s value proposition. |
 |
Roland Self Roland collaborates with a team of analytics professionals who deliver actionable insights to drive growth opportunities for Cotiviti clients. Following two decades in various client engagement roles serving payer clients, Roland leverages his healthcare industry and payment integrity expertise to develop analytical tools and services that support Cotiviti’s client teams to best serve our clients. This includes identification of best fit incremental growth opportunities associated benchmark analytics. |